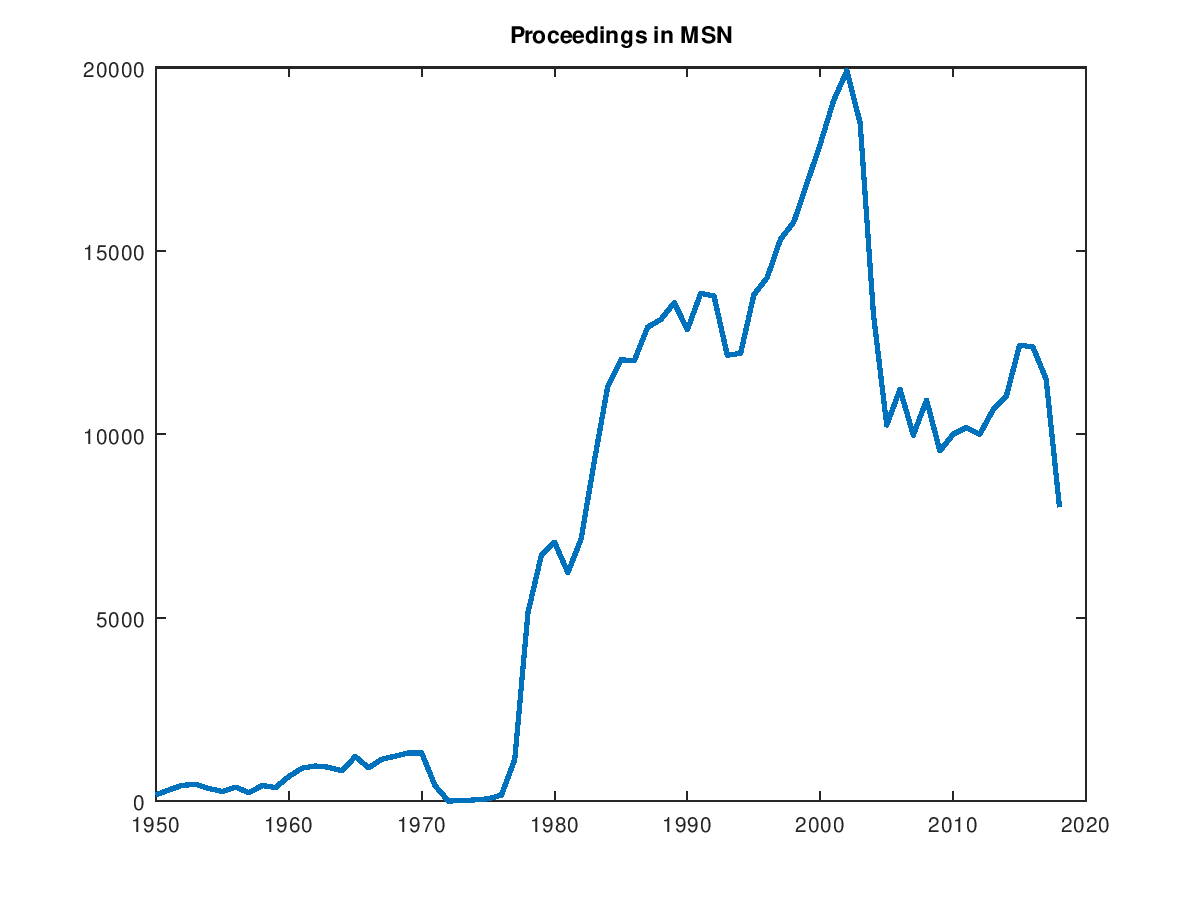
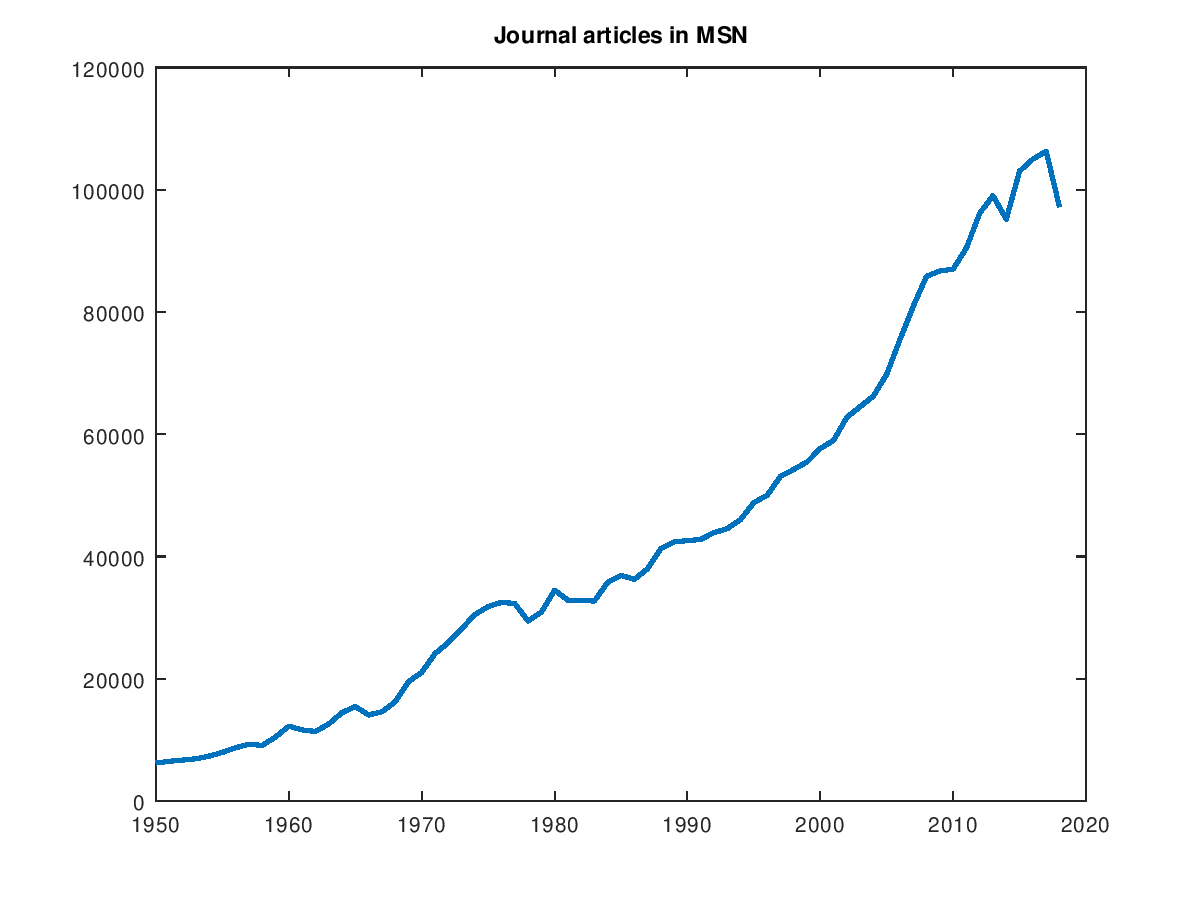
I have learned recently from my colleague Patrick Cattiaux via Michel Ledoux that is it very easy to get from MathSciNet (MSN) the total number of publications per year. Actually I already knew that from my colleague Jean Dolbeault. It is tempting to play with this data. Here are the graphics obtained with few lines of scripting, for journal articles, books, and proceedings. The numbers depend on the selection of titles made by the Mathematical Reviews, which may vary in time, and which can be seen as a good definition of mathematics at large.
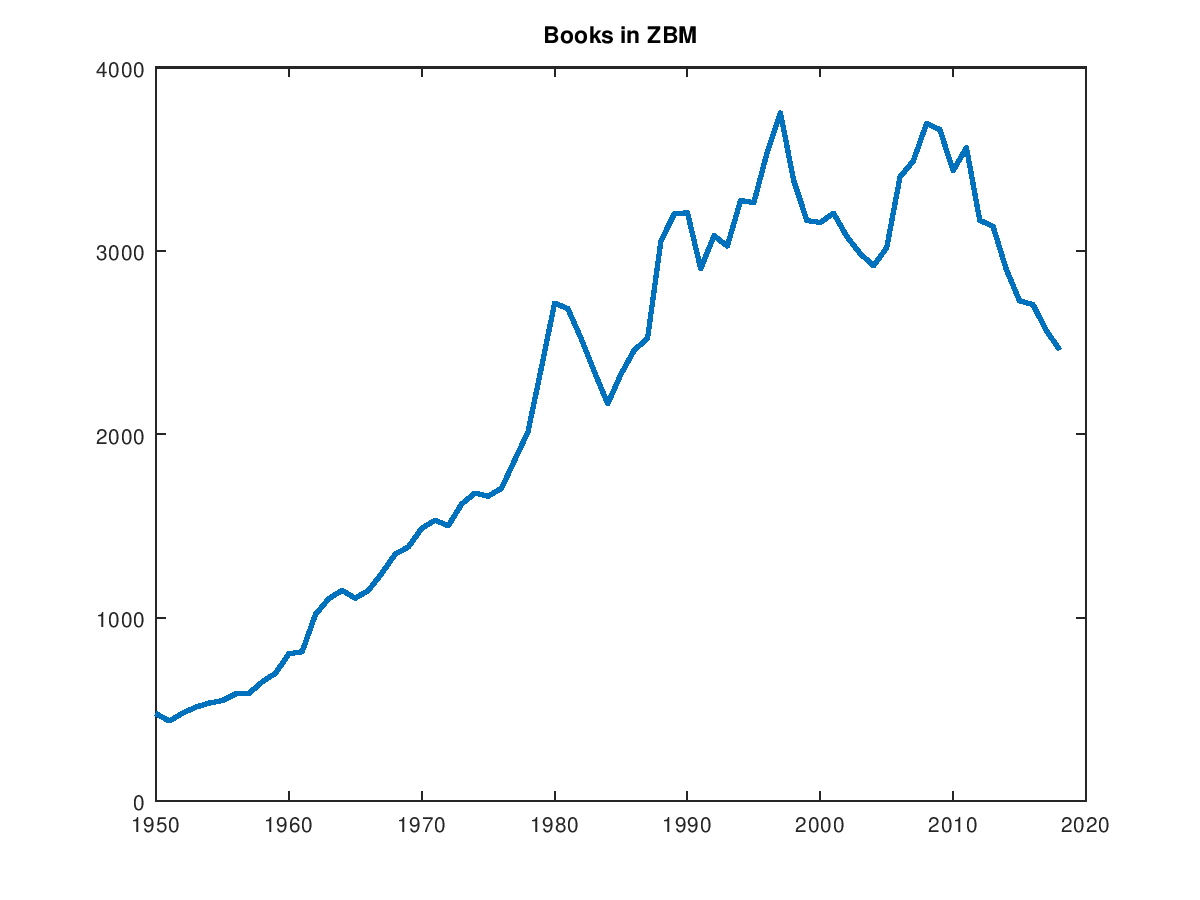
 Now the same with the Zentralblatt MATH (ZBM) database:

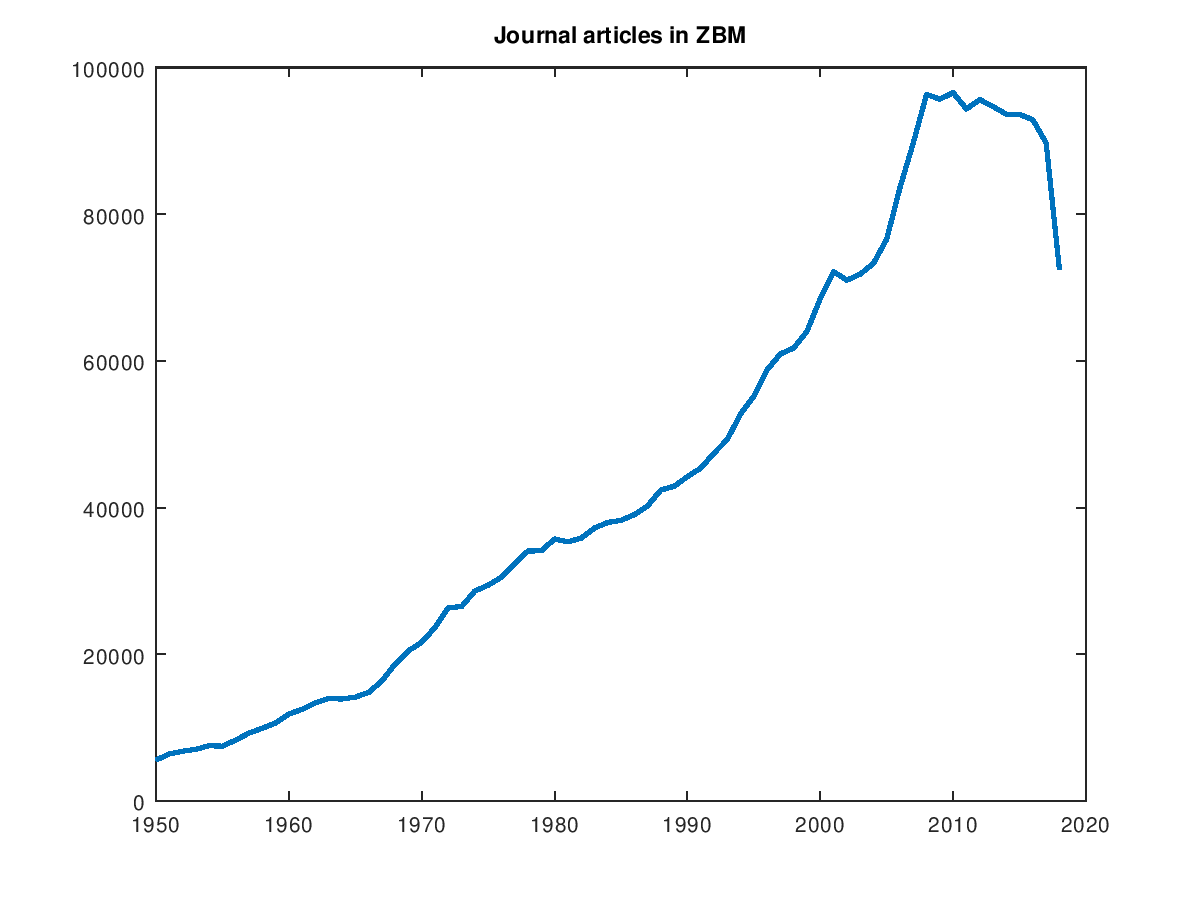
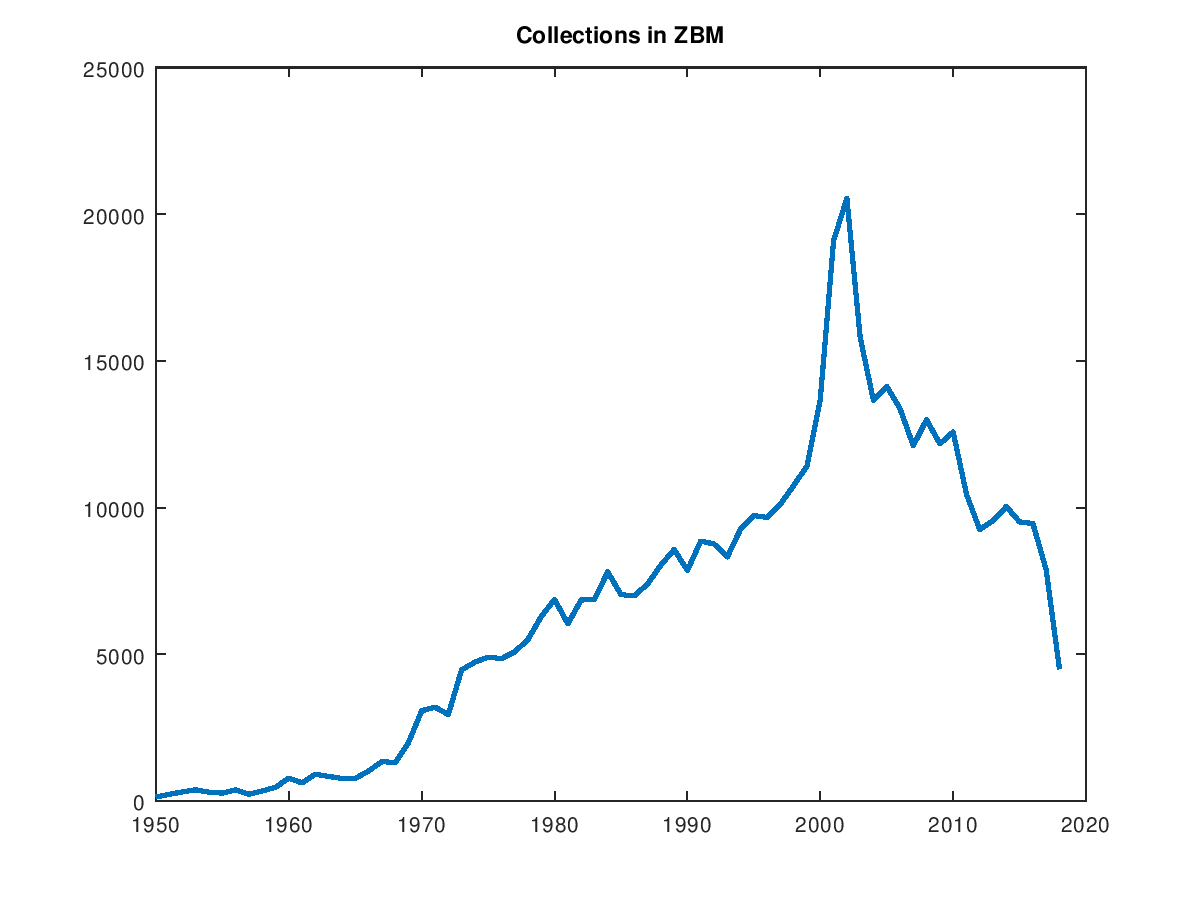
Hello, very interesting plots. A question though: the dip at the end of each plot is 2019 since it is incomplete, right? Or is that a dip in 2018 ?
The last year is 2018. It is possible that the database is still incomplete for 2018.